
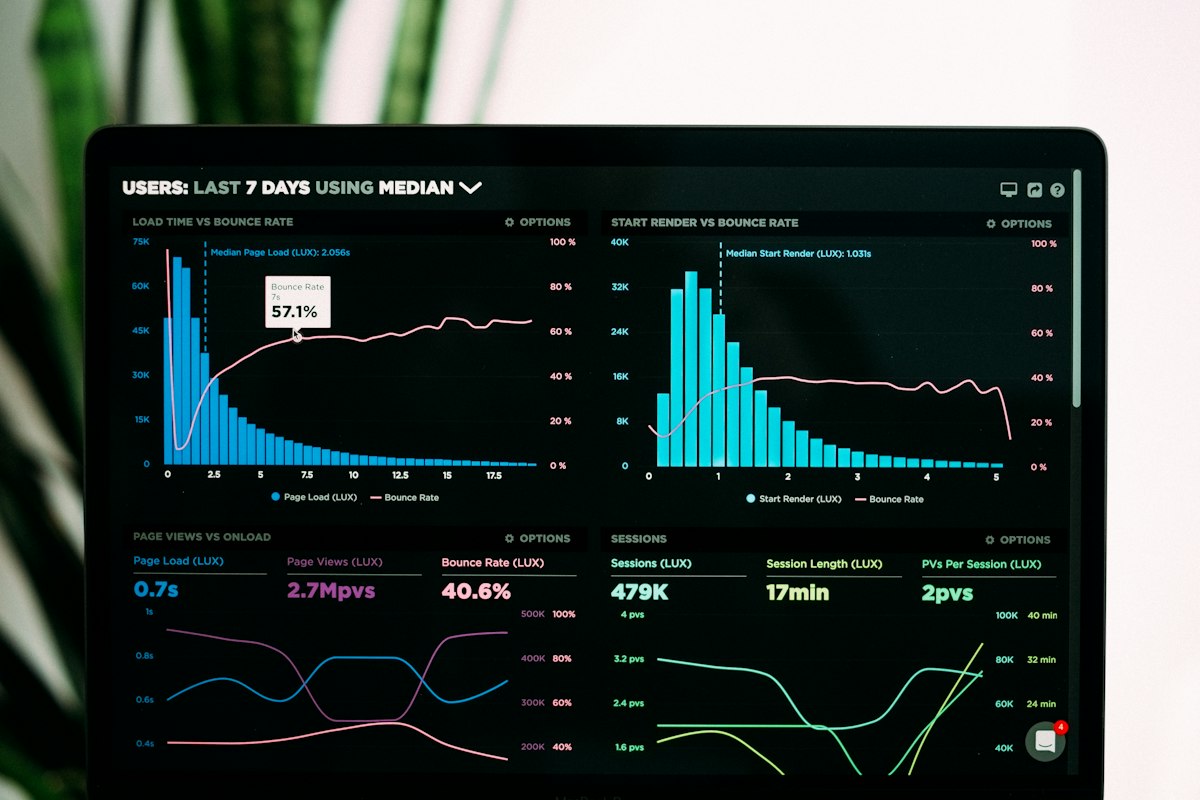
In modern business management, intuition alone is no longer enough to drive consistent revenue growth. Business owners and sales leaders need accurate, real-time data to understand what is working in their sales process, where leads are getting lost, and which strategies generate the highest return on investment.
This is where CRM analytics and reporting become a game-changer. A robust CRM SYSTEM captures data at every touchpoint of the customer journey, turning raw numbers into actionable visual insights that guide smarter business decisions.
For businesses looking for the Best CRM Software in Kerala, understanding CRM reporting capabilities is essential for gaining complete clarity over sales performance and accelerating growth.
What Are CRM Analytics and Reports?
CRM analytics refers to the process of tracking, analyzing, and visualizing customer, sales, and operational data stored within your CRM platform.
Instead of manually compiling spreadsheets at the end of every month, an integrated CRM system automatically aggregates performance data and presents it through dynamic dashboards and customizable reports.
Key areas tracked by CRM analytics include:
- Lead generation volume and acquisition channels
- Lead conversion rates across each sales stage
- Sales pipeline health and total deal value
- Average sales cycle duration (time taken from inquiry to closure)
- Individual sales executive activity and conversion performance
- Win/loss analysis and reasons for dropped deals
- Revenue forecasts and monthly/quarterly targets
The Problem with Spreadsheet-Based Reporting
Many growing businesses still rely on manual spreadsheets to track sales. While spreadsheets can work for very small operations, they quickly become a liability as the business expands:
- Static and Outdated: Reports are historical rather than real-time; by the time a spreadsheet is compiled, the data is already old.
- Prone to Human Error: Formula errors, accidental overwrites, and missing rows lead to misleading metrics.
- No Real-Time Visibility: Managers cannot see daily deal progress or immediate bottlenecks.
- Lack of Accountability: Tracking individual follow-up completion and activity levels across reps is difficult.
Spreadsheets vs Visual CRM Analytics
| Dimension | Manual Spreadsheets | CRM Analytics & Dashboards |
|---|---|---|
| Data Freshness | Weekly or monthly manual updates | Live, real-time updates as activities occur |
| Visual Insights | Rows of numbers, complex manual charts | Interactive charts, pipeline funnels, and KPI cards |
| Drill-Down Ability | Requires manual filtering and search | Click on any metric to view underlying leads/deals |
| Forecasting Accuracy | Rough estimates based on manual formulas | Weighted pipeline calculations based on deal stages |
| Time Required | Hours of weekly manual compilation | Zero compilation time; reports generate instantly |
Essential Sales Reports Every Business Needs
1. Lead Source and ROI Report
This report identifies where your best leads come from—whether your website, Google ads, WhatsApp campaigns, exhibitions, or client referrals—and which channels deliver the highest conversion rates. This allows you to allocate your marketing budget effectively.
2. Sales Funnel and Conversion Rate Report
A visual conversion funnel shows how many leads progress from Inquiry → Contacted → Qualified → Quotation → Closed Won. If you notice a high drop-off rate between Quotation and Negotiation, you can address pricing or proposal quality immediately.
3. Sales Representative Performance Report
Managers can evaluate team members fairly based on concrete metrics, such as number of calls logged, meetings conducted, quotations dispatched, and revenue generated.
4. Deal Win/Loss Analysis
Tracking why deals were won or lost (e.g., price, competitor feature, delivery timeline, lack of follow-up) provides invaluable feedback for product, pricing, and sales coaching.
5. Revenue Forecasting Report
By analyzing deals currently in the pipeline alongside their expected closing dates and probability percentages, business owners can forecast upcoming cash flow and plan inventory or hiring accordingly.
How CRM Analytics Drive Business Growth
Implementing a data-driven business CRM system in Calicut enables companies to:
- Identify Bottlenecks Early: Spot stalled deals before they become lost opportunities.
- Optimize Sales Coaching: Help struggling sales reps by analyzing where in the pipeline they need support.
- Improve Pricing Strategies: See which quotation values have the highest win rates.
- Enhance Customer Retention: Track customer repurchase cycles and identify renewal opportunities.
Choosing a CRM Software Company in Calicut for Reporting
When consulting with a CRM software company in Calicut, ask for a demonstration of their reporting module. Ensure that reports can be filtered by date range, branch, sales rep, and lead source, and verify that data can be exported to Excel or PDF when needed.
Final Thoughts
Data is one of your business's most valuable strategic assets. When you transition from guesswork to data-backed CRM analytics, you gain clear visibility into your entire sales engine, enabling you to make confident decisions that drive sustainable, predictable revenue growth.
Frequently Asked Questions
What is the most important metric to track in a CRM?
While all metrics matter, the Lead Conversion Rate (percentage of total leads that turn into paying customers) and Sales Velocity (time taken to close a deal) are two of the most critical indicators of sales health.
Can CRM reports be customized for specific business requirements?
Yes. Quality CRM platforms allow businesses to create custom report filters, select specific data fields, and build personalized dashboards tailored to their unique operational workflows.
How often should sales managers review CRM analytics?
Daily dashboards are useful for monitoring team activity and urgent follow-ups, while weekly and monthly reviews are ideal for pipeline health, conversion trends, and revenue forecasting.